Ham Radio Propagation Tools

Understanding HF Propagation Reports For Ham Radio Operators
Whether you’re new to Ham Radio or have decades experience operating on the HF (high frequency) bands, it is often a challenge trying to interpret the various propagation reports and charts available on the Internet. There are numerous and complex measurements about the Sun’s activities as it relates to RF signal conditions than most care to understand. However, there are a few very important measurements to learn if you want to understand propagation reports. The charts and detailed index summaries below are explained at a level that is easy to understand, and most importantly, will effectively enhance your ability to make use of the data. Let’s get started….
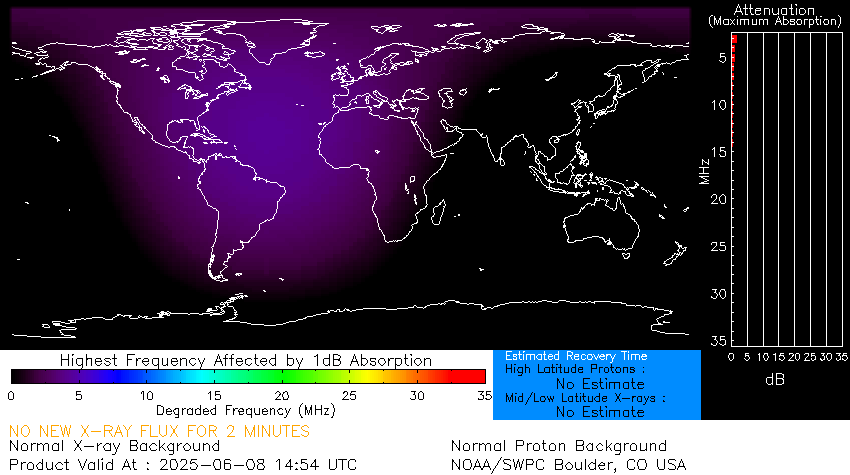
Ok, let’s look at another chart that is extremely helpful for Ham Radio HF enthusiast. The chart below is a Radio Signal Absorption Model which consists of the following four dynamic components; a global map of the highest frequency affected by absorption of 1 dB due to either solar X-ray flux or SEP events or a combination of both, an attenuation bar graph, status messages, and an estimated recovery clock. Let’s review a brief outline of those four components.
- Global Frequency Map: This global frequency map graphically illustrates the Highest Affected Frequency (HAF) as a function of latitude and longitude. HAF is defined as the frequency which suffers a loss of 1 dB during vertical propagation from the ground, through the ionosphere, and back to ground. Radio frequencies lower than the HAF suffer an even greater loss as described in the Attenuation Bar Graph section. Therefore, any frequency lower than the HAF will likely suffer poor propagation for Ham Radio HF communications.
- Attenuation Bar Graph: A bar graph on the right-hand side of the chart displays the expected attenuation in decibels as a function of frequency for vertical radio wave propagation at the point of maximum absorption Amax on the globe. Note: attenuation results in signal quality and/or strength loss. The higher the attenuation value in dB, the greater the signal disruption.
- Status Messages: Text messages appear at the bottom of the frequency map which include two valuable propagation predictions; (a) X-ray Condition, (b) Proton Condition. These messages indicate possible signal impact that range from Normal to Extreme.
- Estimated Recovery Clock: After an X-ray event (defined as flux greater than M1 levels) peaks and the flux begins to decrease, an estimated recovery time to normal background conditions is calculated. The estimate is based on the following empirically derived values relating the magnitude of a solar flare to the statistical average of the flare duration; M1.0 -> 25 minutes, M5.0 -> 40 minutes, X1.0 -> 60 minutes, X5.0 -> 120 minutes.
As Amateur Radio (Ham) Operators, we’re starting to understand how to make use of the chart below. For example, if you’re wanting to communicate on a specific HF band, first verify your frequency of choice is at or above the HAF for best results. This chart represents live data which is updated at least every 5 minutes. Refresh this page as needed for the most updated information.
| D Region Absorption Prediction - Global (1 DB ABS) |
 |
| The D-Region Absorption chart above addresses the operational impact of the solar X-ray flux and SEP events on HF radio communication. Long-range communications using high frequency (HF) radio waves (3 - 30 MHz) depend on reflection of the signals in the ionosphere. Radio waves are typically reflected near the peak of the F2 layer (~300 km altitude), but along the path to the F2 peak and back the radio wave signal suffers attenuation due to absorption by the intervening ionosphere. The D-Region Absorption Prediction model is used as guidance to understand the HF radio degradation and blackouts this can cause. |


